What data you must capture for a test case?
As a manual tester, the typical workflow involves starting the test, identifying bugs, reporting them, and wrapping up the task. The bug report often serves as a record of what was tested and where issues were found.
But what happens when you're testing the same module for the nth time? Or when regression testing is the primary task and no new bugs are found? In such cases, the bug list becomes minimal or even non-existent. So how do you showcase the work done by the testing team when there’s little to no defect output?
The same challenge exists in automation testing. If a script fails, is reporting the failed assertion enough? Or does the automation report need more context to reflect what was actually validated?
This blog will highlight key elements you can include in both manual and automation testing reports to demonstrate testing effort—even when bugs are few.
Start with What You’re Testing
The first section of your test report should clearly outline what is being tested. This sets the context and helps stakeholders understand the current phase of testing. Include the following details:
- Module: Specify the name of the module under test.
- Requirement: Clarify the specific requirement being verified. As a module matures, the number of requirements for it also grows. For instance, in a login module, are you testing the number of incorrect login attempts or the lockout duration after repeated failures?
- Environment: Indicate where testing is being performed — QA, UAT, or Live.
- Tester Name: Mention whether the test was executed by a human tester or an automated bot.
- Datetime: Log the date of execution. Past test dates often help in assessing regression scope or identifying when a specific scenario was last verified.
Tester’s Tip: Before starting any test, prepare a quick checklist covering the test scope, environment, and objective. It ensures clarity and consistency — especially useful when scripting or handing over test cases.
Structure Your Test Procedure
When a test case is lengthy, it's important to break it down into smaller, logical steps and report the outcome of each part. A single test case often includes multiple actions—such as clicking buttons, filling forms, or triggering APIs—and documenting each of these steps provides better clarity and traceability. Example: Testing project initialization settings for a new user. This scenario can be divided into the following steps:
- Register as a new user
- Verify that the system displays the fresh user settings page
- Check if new-user benefits or freebies are credited
- Confirm that a welcome email is received
By structuring the test case into smaller sub-tasks, you ensure that each action is clearly defined, tested, and reported. In your final test report, include the overall scenario as a heading and then document each step beneath it. This improves visibility into what was tested and helps identify where failures occur if any.
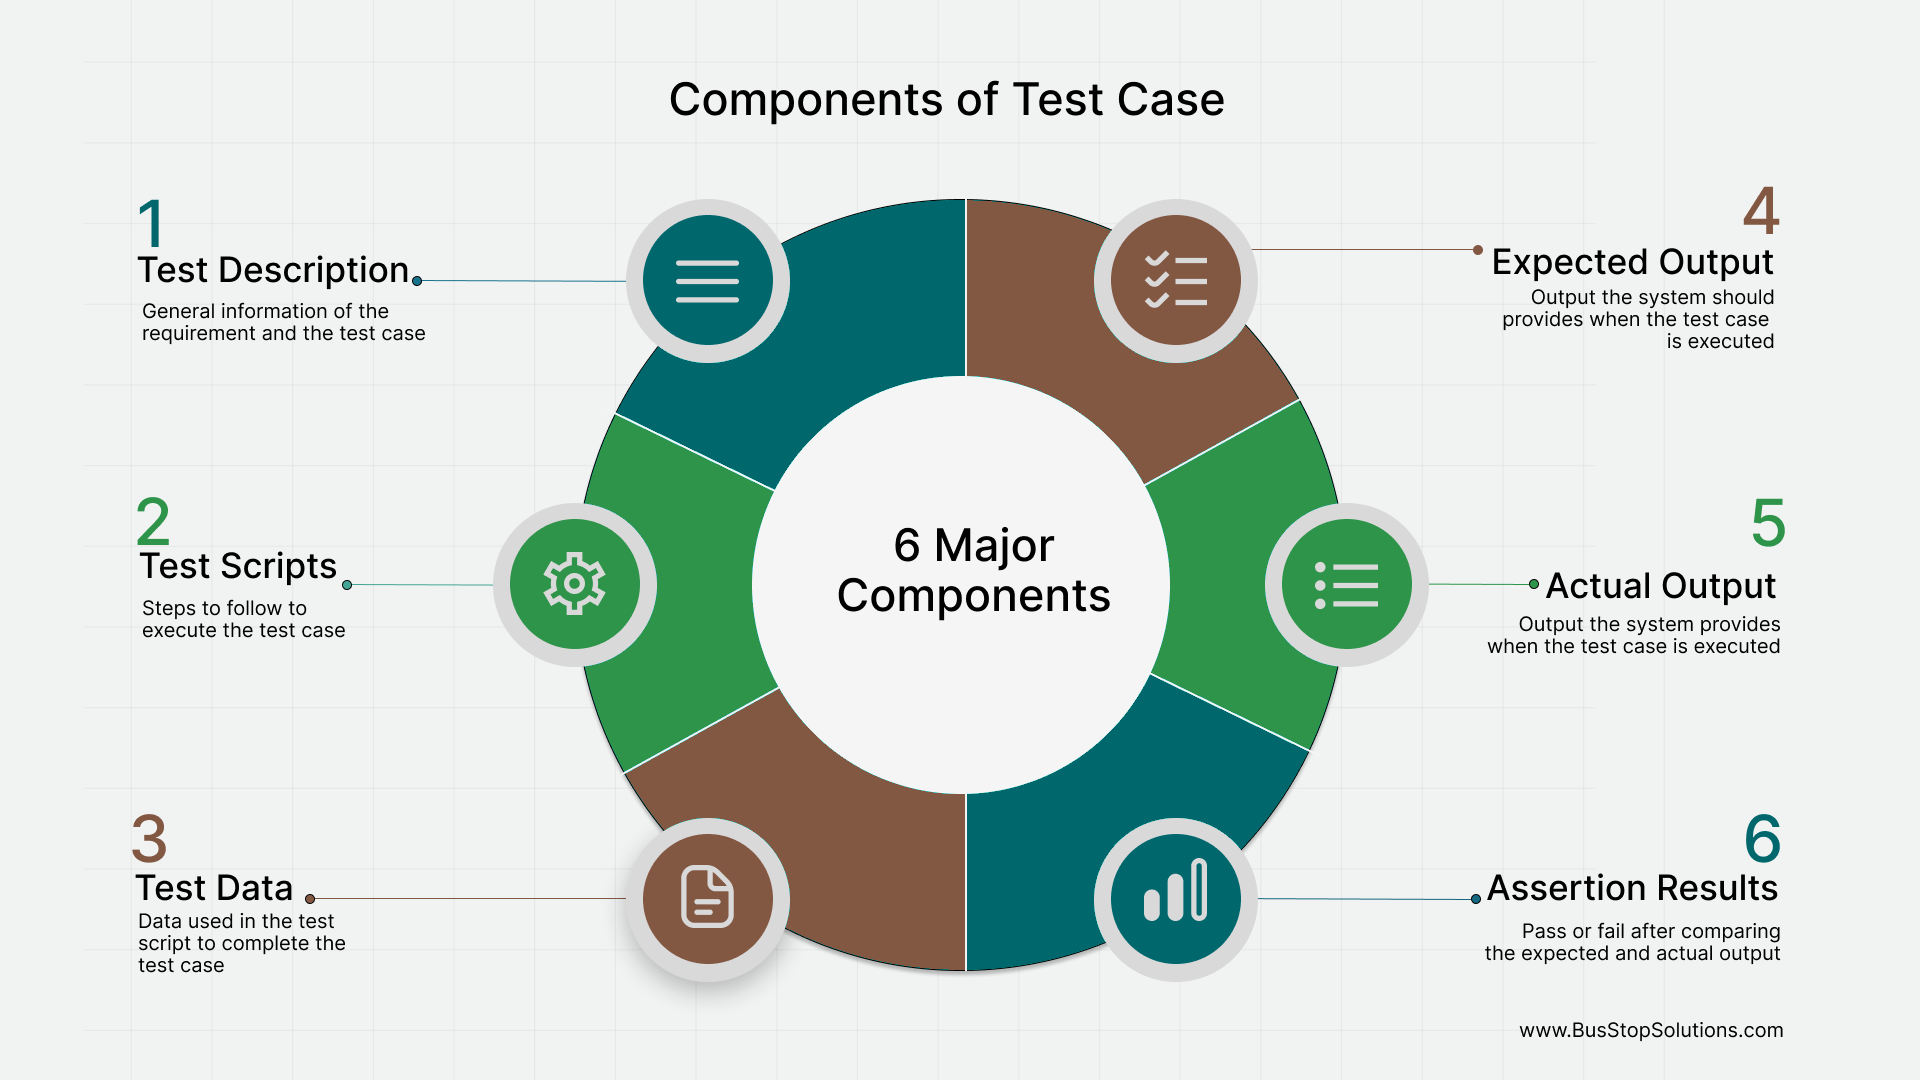
Specify Test Data, Expected Output, and Actual Output
Once the test steps are defined, the next important task is to capture the key data points and results. This helps illustrate how the system responds to specific inputs and whether it behaves as expected. You can guide this part of your reporting by asking yourself:
- What data was used for the test?
- What was the expected system response?
- What was the actual response from the system?
Here’s how to break it down:
- Test Data– Document the type of data used during testing - Valid inputs, invalid inputs, boundary values and empty or missing data Document the source of data – manual input, file uploads , database connection, etc
- Expected Output: For each test step and data point, define what the system should do: Should it return a success message? Should it block the user or raise an alert? Should it trigger a download or redirect? Should it remain idle with no response? This helps in setting a clear baseline for comparison.
- Actual Output: Record what the system actually did when the test was executed: Was a success or error message shown? Did the system allow or prevent certain actions? Did the file download occur or fail? This gives visibility into the system’s real-time behavior.
- Assertions: This is where you compare the expected vs. actual output. If both match, the test is marked as Passed. If not, it’s marked as Failed. Example: If you hit an API expecting a 200 OK status, and the system returns 200, the assertion passes. If it returns 404 Not Found, the assertion fails.
Adding these details ensures your test reports are precise, traceable, and useful for debugging and future test planning.
| Step | Test Data Used | Expected Output | Actual Output | Assertion (Pass/Fail) |
|---|---|---|---|---|
| 1. Register new user | Email: user@example.comPassword: Welcome@123 | User account should be createdRedirect to welcome page | User created successfullyRedirected to dashboard | ✅ Pass |
| 2. Upload invalid file | File: corrupted.pdf | Show error: “Invalid file format” | Error message displayed correctly | ✅ Pass |
| 3. Hit API with valid token | GET /users/listToken: Valid | Response 200 with user data list | Status 200 OKReturned user list | ✅ Pass |
| 4. Submit empty login form | Username: (blank)Password: (blank) | Show validation: “Username required” | Page refreshed, no error shown | ❌ Fail |
Plan for Failures and Debugging
Automation scripts are designed to save time and effort by running tests consistently and reliably. However, their value lies not just in executing tests but in accurately identifying what passed, what failed, and why. Since these tests aren’t observed in real time by a human, you need supporting documentation and tools to investigate failures efficiently. Here are some essential elements to include:
- Logs: Logs should capture key details like: Input values, output responses, and timestamps of execution. Analyzing logs across passed and failed cases helps pinpoint where and why a test failed, making debugging faster and more precise.
- Notifications: Automated tests should trigger notifications once execution is complete. These can be system alerts, email updates, or dashboard summaries. Notifications remind stakeholders that the automation process is active, as it's easy to forget tasks that don't involve human efforts. It can include a full test report or a quick summary (e.g., "90 tests run, 87 passed")
- Test Flow Visibility: Complex test flows may involve multiple steps. Reports should offer high-level visibility into: Which step the test failed at? What assertion failed? What condition triggered the failure? This clarity helps in narrowing down the issue quickly.
- Exception Handling and Retrying: Sometimes, failures are temporary, caused by caching issues, network hiccups, or server downtimes. Build logic into your automation to retry the process and mark it as failed only if the retry fails. This approach helps avoid false negatives and reduces noise in your reports.
Tester’s Tip: Create reusable templates for logging, error handling, and test reporting. Continuously refine them as you move across projects. This not only improves efficiency—it’s also how you build deep, transferable testing skills.
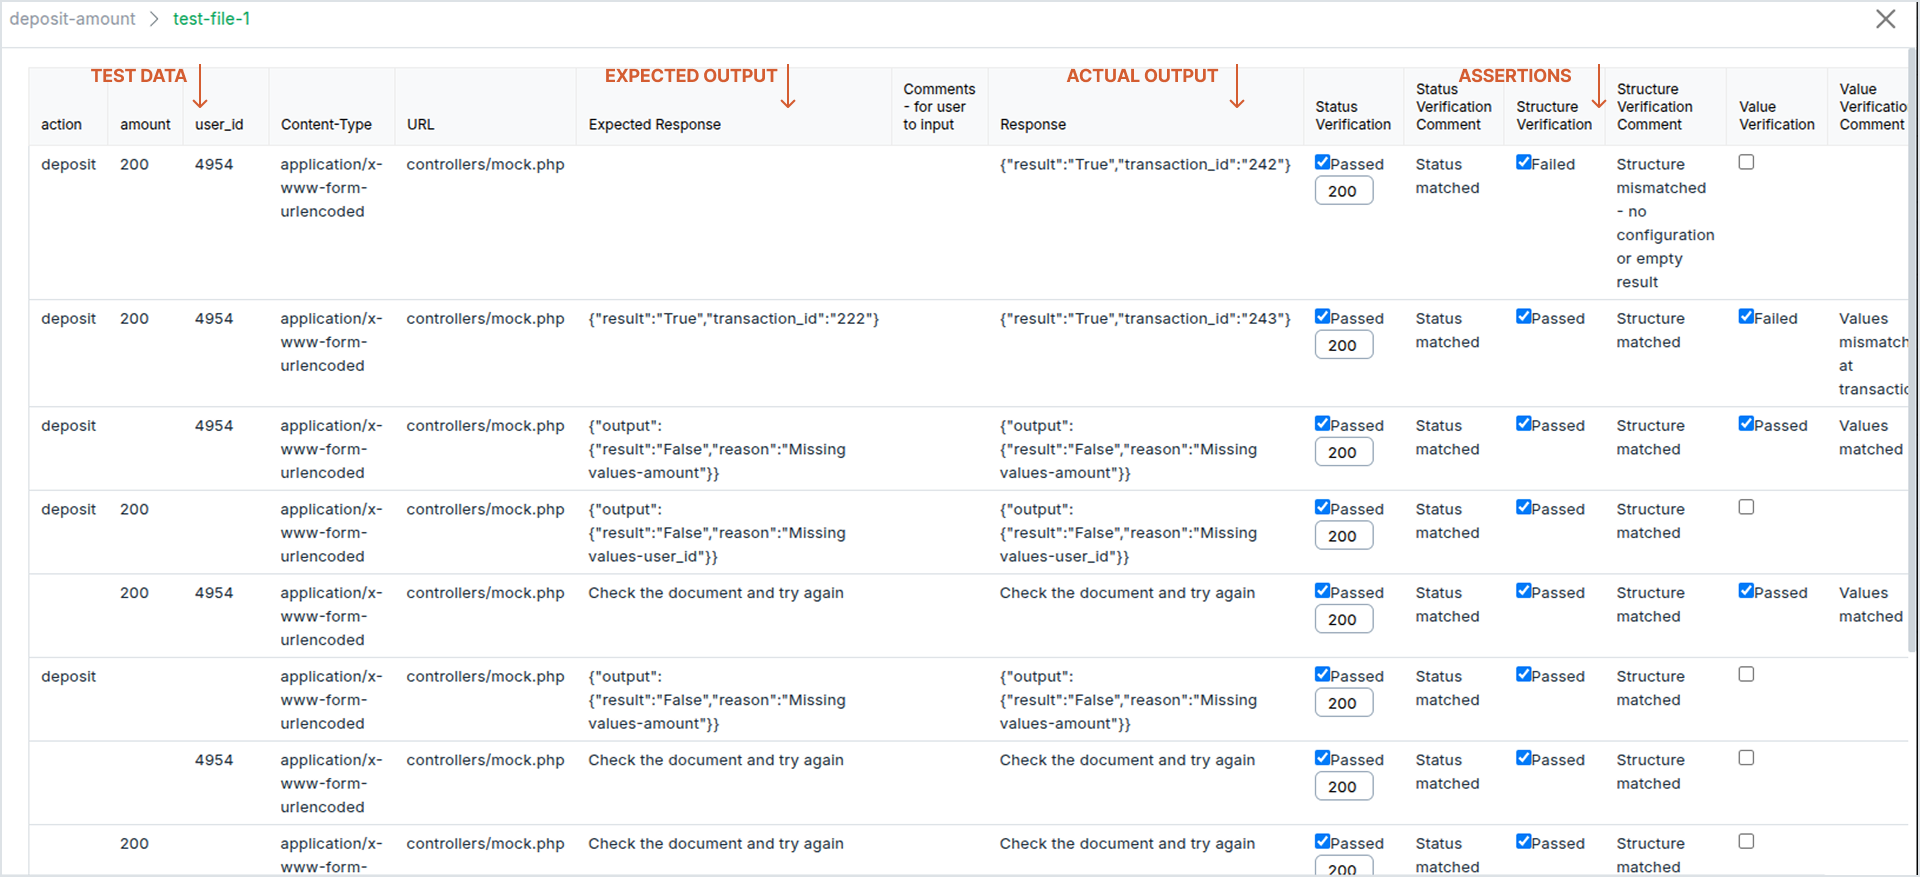
How BusStop Makes API Test Reporting Easy
BusStop is a no-code API automation testing tool designed to make test execution and reporting fast, flexible, and simple, without writing a single line of code.
Once your APIs are configured as individual requests, you can group them into test suites. BusStop then auto-generates a CSV template based on your API configuration, making it easy to manage test data and reporting in a structured format. At a glance you can see what was tested? What was the expected ouput? And, What is the actual output?
What Makes BusStop’s Reporting So Effective
- Define Scope Clearly : Each API is configured as a Request, and multiple requests are grouped into a Suite. This structure gives clarity to the requirement being testing in a module.
- Simplify Test Data Management: BusStop provides a preformatted CSV template for uploading bulk test data. You can upload: Valid data files, Invalid data files, Boundary value test files, etc. Run them one by one to isolate and analyze specific system behaviors.
- Set and Refine Expectations: The expected output is an optional column in the CSV while uploading the test data. If you're unsure about the expected results:
1. Upload and execute the file without filling expected output.
2. BusStop will generate an output file with actual API responses.
3. Use this as a reference to update your input file with expected results and re-upload for validation.
This two-step method simplifies assertion setup in bulk testing. - Track Results Automatically: BusStop validates HTTP status codes, response structure, response values, and execution timestamps. It also gives a quick summary of passed and failed tests, so you know exactly what needs attention.
- Recover Fast and Run at Scale: BusStop executes the API one row at a time and all rows of a file as a batch. Thus, it can run 100+ API requests with a single click.
- Get Comprehensive Reports: After executing a file and downloading it, the file includes the below information:
API configuration
Test data
Execution timestamp
Expected vs. actual output
Assertion results
Everything is consolidated into one clean report.
BusStop makes you faster, clearer, and more confident—without writing code.
Final Thoughts
As a tester, you bring the context, the scenarios, and the eyes for detail. But to make your tests results easily understood by your managers and seniors, you need to capture scope, data, outcomes, and failure handling clearly.
Before your next test run, pause and ask—do I have all the details I need? If not, BusStop can help you get organized.